
Q5Comprehension1 Mark24 Dec 2023
Passage
Based on the above data, answer the given subquestions.
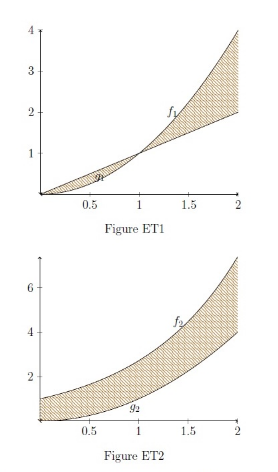
The functions and denote the savings of Srikanth and Subendu respectively throughout the last 2 years.
The predicted savings of both during the same duration are given by the functions and respectively. The curves represented by and are shown in Figure ET1, and and are shown in Figure ET2.
Suppose the area of the region bounded by the two curves (the original curve and the predicted curve) in the interval is defined to be the error in prediction. Use this information to choose true and false statements.
Is this statement True or False: The area under the curve bounded by in the interval is .