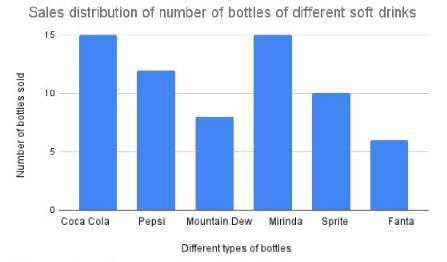
Figure Q.1 shows the sales distribution of the number of bottles of different types of soft drinks in a shop on a particular day. Which of the following option(s) is/are true?
Q24
7 Jul 2024
Statistics 1 · Week 2
Q24.Figure Q.1 shows the sales distribution of the number of bottles of different types of soft drinks in a shop on a particular day. Which of the following option(s) is/are true?