
Q41Comprehension3 Marks5 Jun 2022
Passage
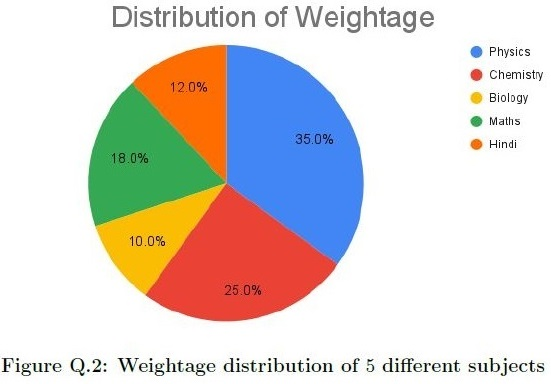
Figure Q.2 shows the pie chart representation of the weightage distribution of different subjects in an exam. Based on this information, answer the given subquestions.
Choose the correct statement(s):
Statistics 1 · Week 2