Question 10
Est. 2 min
Marks:+2.000.00
Table Q.4 presents the frequency distribution of various T-shirt sizes among a group of 50 students.
According to this data, which is the correct graphical representation of this data?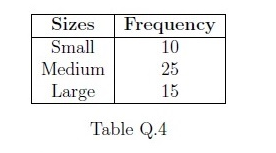
Multiple correct
Medium Difficulty
23 February 2025