Question 11
Est. 1 min
Marks:+2.000.00
Passage
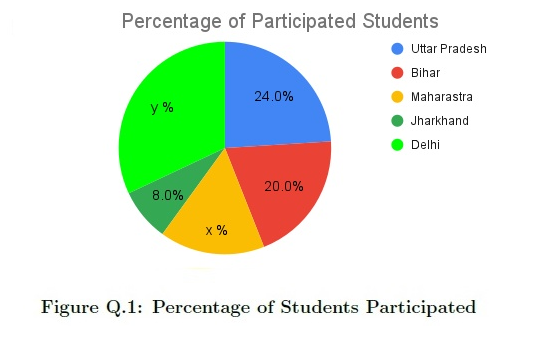
Figure Q.1 shows the pie chart representation of the percentage of participated students in a particular game from different states. Total number of participated students is 125.
Based on the data, answer the given sub-questions.
Question
Find the number of students from Uttar Pradesh.
Comprehension
Easy Difficulty
23 February 2025