Question 1
Est. 2 min
Marks:+2.000.00
Passage
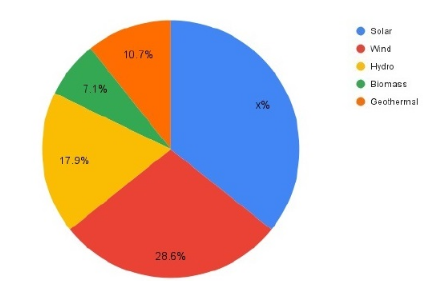
Figure Q.2 illustrates the proportional distribution of renewable energy consumption across various sources throughout the country. The total renewable energy consumption is given as kWh.Based on the above information, answer the given subquestions:
Question
Find the value of .
Comprehension
Easy Difficulty
25 February 2024