Question 2 - Charts of Categorical Data — pie chart: proportions of a whole Practice | Prasnya
Prasnya
Continue with Google
Practice path
Dashboard
Exam
Qualifier / Quiz 1
Go to subject
Statistics 1
Go to chapter
Week 2
Go to topic
Describing Categorical Data - Describing Categorical Data
Go to subtopic
Charts of Categorical...
Question 2
00:00
Est. 1 min
Marks:
+2.00
0.00
Passage
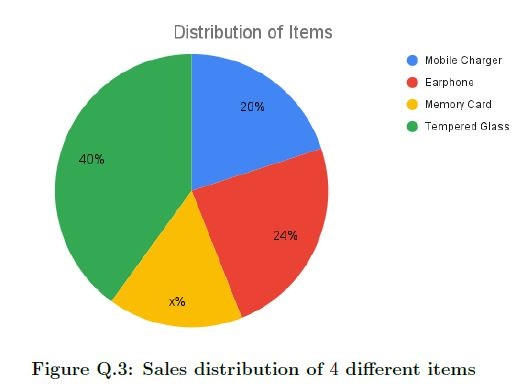
Figure Q.3 represents the distribution of sales of
4
4
different items in a mobile shop last month. Based on this information, answer the given subquestions.
Question
What is the value of
x
x
?
Comprehension
Easy Difficulty
16 October 2022
Your answer