Question 2 - Frequency Distributions — relative frequency Practice | Prasnya
Prasnya
Continue with Google
Practice path
Dashboard
Exam
Qualifier / Quiz 1
Go to subject
Statistics 1
Go to chapter
Week 2
Go to topic
Describing Categorical Data - Describing Categorical Data
Go to subtopic
Frequency Distributions —...
Question 2
00:00
Est. 2 min
Marks:
+2.00
0.00
Passage
The number of products purchased by each individual customer is shown in Table 4
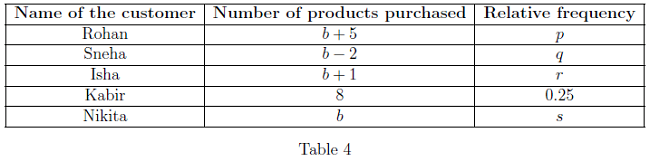
Question
Find the value of q + r. Enter the answer correct to two decimal places.
Comprehension
Easy Difficulty
15 March 2026
Your answer