Question 1 - Interquartile Range and Five-Number Summary — IQR = Q3 − Q1; stem-and-leaf plot interpretation Practice | Prasnya
Prasnya
Continue with Google
Practice path
Dashboard
Exam
Qualifier / Quiz 1
Go to subject
Statistics 1
Go to chapter
Week 3
Go to topic
Describing Numerical Data - Describing Numerical Data
Go to subtopic
Interquartile Range and...
Question 1
00:00
Est. 3 min
Marks:
+4.00
0.00
The following stem and leaf diagram represents the marks (out of
50
50
) obtained by
20
20
students in an A-level mathematics paper.Based on the given information, select the correct options from the following:
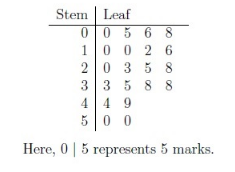
Multiple correct
Medium Difficulty
25 February 2024
A
There are
9
9
students who have scored greater than
20
20
marks.
B
The data is bimodal.
C
Mean is greater than the median.
D
Interquartile range is
28
28
.