Prasnya
Prasnya
Prasnya
Continue with Google
Question 30 - Week 4 Practice | Prasnya
Q30
00:00
5 Jun 2022
Q30.
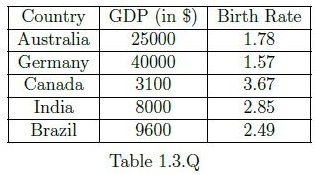
By using the scatter plot for the data given in Table 1.3.Q, we can conclude that:
@passage
A
There is a positive linear association between the birth rate and
GDP
\text{GDP}
GDP
.
B
There is a negative linear association between the birth rate and
GDP
\text{GDP}
GDP
.
C
There is no linear association between the birth rate and
GDP
\text{GDP}
GDP
.
Save
Read
Check
Details
Q30
00:00
5 Jun 2022
Q30.
By using the scatter plot for the data given in Table 1.3.Q, we can conclude that:
@passage
A
There is a positive linear association between the birth rate and
GDP
\text{GDP}
GDP
.
B
There is a negative linear association between the birth rate and
GDP
\text{GDP}
GDP
.
C
There is no linear association between the birth rate and
GDP
\text{GDP}
GDP
.
Save
Read
Check
Details