
Q8Numerical4 Marks26 Oct 2025
Table 3 displays data recorded by an ice-cream vendor, showing the outdoor temperature (°C) and the number of ice creams sold on four different days.
Calculate the population covariance between temperature and ice creams sold.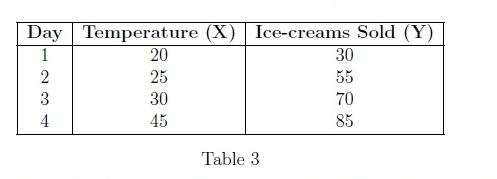
Press Enter to check.