Question 1 - Pearson Correlation Coefficient — interpreting $r$: direction and strength of linear association Practice | Prasnya
Prasnya
Continue with Google
Practice path
Dashboard
Exam
Qualifier / Quiz 1
Go to subject
Statistics 1
Go to chapter
Week 4
Go to topic
Association Between Two Variables - Association Between Two...
Go to subtopic
Pearson Correlation Coefficient...
Question 1
00:00
Est. 2 min
Marks:
+2.00
0.00
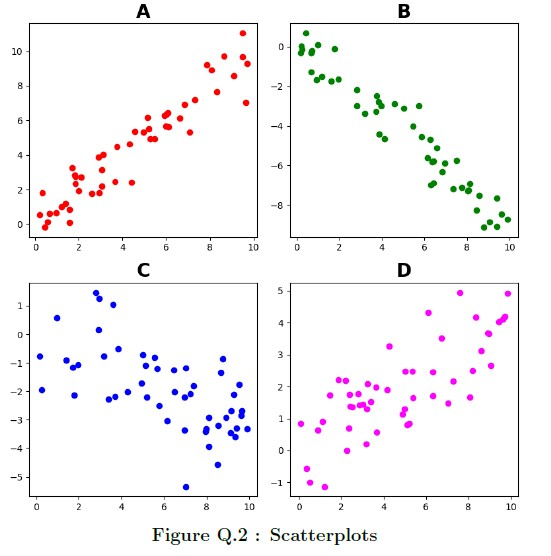
Consider the following four images of the scatter plot.Please select the option that will represent the correlation values arranged in ascending order.
Single correct
Medium Difficulty
07 July 2024
A
A < B < C < D
B
B < C < D < A
C
B < A < C < D
D
A < D < C < B