
Q24Comprehension2 Marks29 Oct 2023
Passage
Based on the above data, answer the given subquestions. The graph of a probability density function of a continuous random variable is shown below, where .
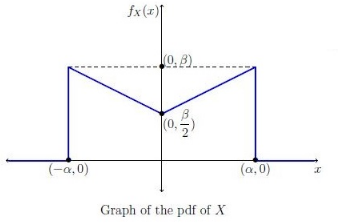
Which of the following is true?
Statistics 2 · Week 4