Q2Multiple correct5 Marks3 Aug 2025
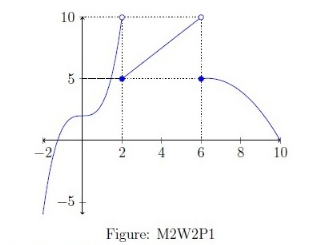
Let Figure M2W2P1 represent the graph of a function . The solid points denote the value of the function at the points, and the values denoted by the hollow points are not taken by the function. Choose the set of correct options.