Question 2 - Week 7 Practice | Prasnya
Prasnya
Continue with Google
Practice path
Dashboard
Exam
Quiz 2
Go to subject
Mathematics 1
Go to chapter
Week 7
Question 2
00:00
Est. 2 min
Marks:
+5.00
0.00
Let Figure M2W2P1 represent the graph of a function
f
f
. The solid points denote the value of the function at the points, and the values denoted by the hollow points are not taken by the function. Choose the set of correct options.
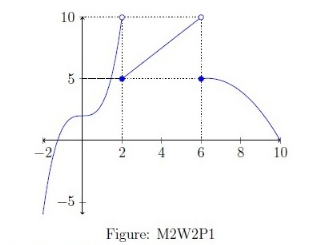
Multiple correct
Medium Difficulty
03 August 2025
A
lim
x
→
2
−
f
(
x
)
=
10
\lim_{x\to 2^-} f(x)=10
B
lim
x
→
6
+
f
(
x
)
=
10
\lim_{x\to 6^+} f(x)=10
C
f
f
is continuous at
x
=
4
x=4
.
D
f
f
is differentiable at
x
=
2
x=2
.